|
|
Histogram
A histogram is a graphical representation of the distribution of data in a format similar to a bar plot. The bars can be plotted either vertically or horizontally. A simple histogram chart can be created in R with the hist function. In the example below, data from the sample "trees" dataset is used to plot a histogram of tree height.
ggplot(trees, aes(x = Height)) + geom_histogram() Example:
> ggplot(trees, aes(x = Height)) + geom_histogram() 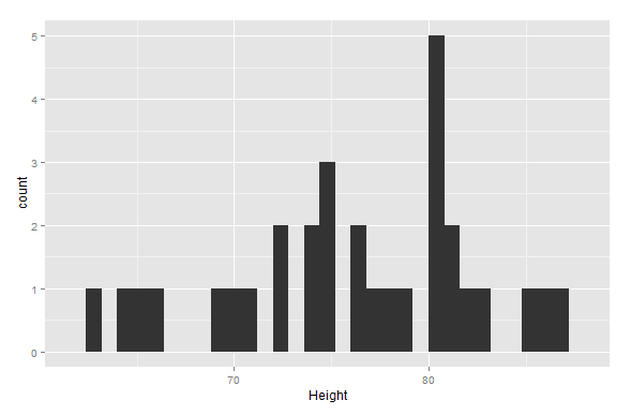
|
