|
|
Add a Reference Line to a Box Plot
Horizontal reference lines can be added to a Box Plot using the abline function. Vertical reference lines cannot be added to box plots. boxplot(NumericVector ~ GroupingVariable) abline( h = Axis_Intercept_Value) Example: > boxplot(chickwts$weight ~ chickwts$feed) > abline(h=200) 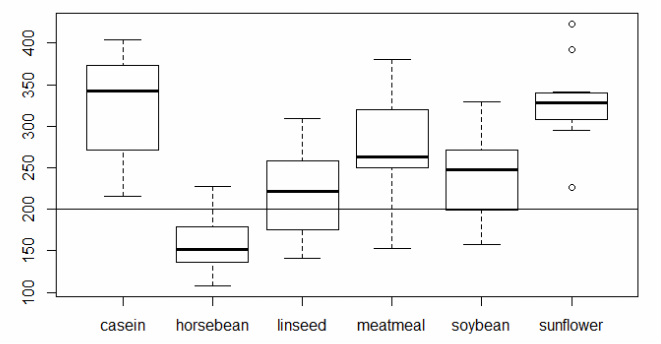
Customize Reference Lines
The default reference line is a simple black line. However, the line color, line type, and line thickness can be customized. Line Color
The line color can be customized using the col argument. boxplot(NumericVector ~ GroupingVariable) abline( h = Axis_Intercept_Value, col = "Color") Example: > boxplot(chickwts$weight ~ chickwts$feed) > abline(h=200, col = "Red") 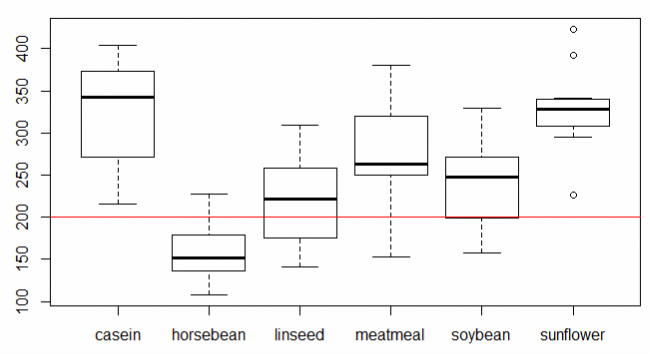
Line Type
The line type can be customized using the lty argument. boxplot(NumericVector ~ GroupingVariable) abline( h = Axis_Intercept_Value, lty = Line_Type_#) The numbers corresponding to each line type are shown below. 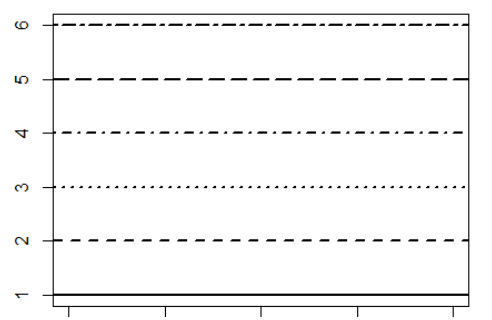
Example:
> boxplot(chickwts$weight ~ chickwts$feed) > abline(h=200, col = "Red", lty = 5) 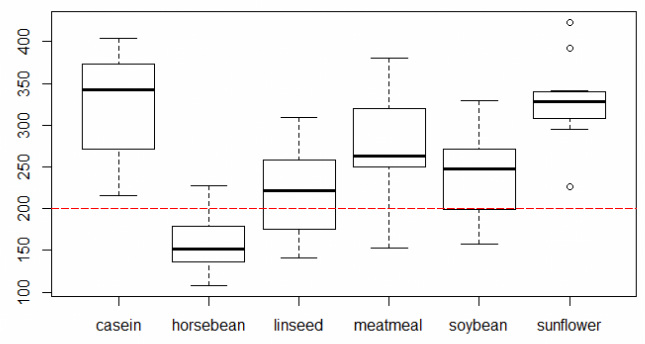
Line Width
The line width can be customized using the lwd argument. boxplot(NumericVector ~ GroupingVariable) abline( h = Axis_Intercept_Value, lwd = Line_Width_#) Example: > boxplot(chickwts$weight ~ chickwts$feed) > abline(h=200, col = "Red", lty = 5, lwd = 3) 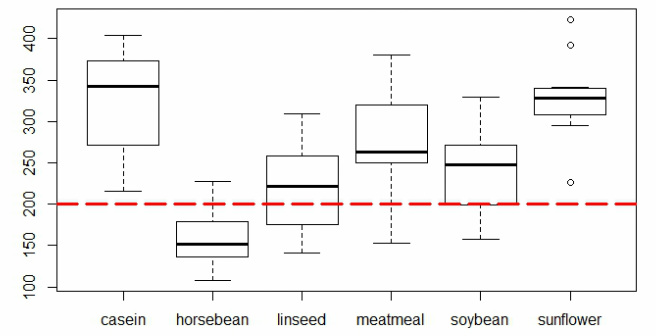
Draw Line behind Bars
The reference line is drawn over the bars by default. It is possible to draw then line behind the bars by re-plotting the boxes over the line using the add argument. boxplot(NumericVector ~ GroupingVariable) abline( h = Axis_Intercept_Value, lwd = Line_Width_#) boxplot(NumericVector ~ GroupingVariable, add = TRUE) Example: > boxplot(chickwts$weight ~ chickwts$feed) > abline(h=200, col = "Red", lty = 5, lwd = 3) > boxplot(chickwts$weight ~ chickwts$feed, add = TRUE) 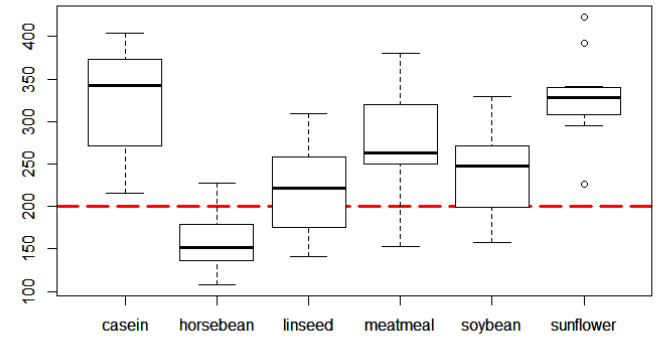
|
