|
|
Customize Layout
The layout of bar plots can be customized per the following sections. Plot Bars Horizontally
Bar plots are plotted vertically by default. They can be plotted horizontally via the horiz argument. barplot( ElementContainingData, horiz = TRUE) Example: > barplot(pressure$pressure, horiz = TRUE) 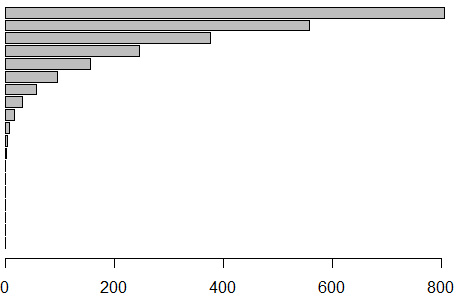
Define Spacing between Bars
The spacing between bars can be customized via the space argument. barplot( ElementContainingData, space = Value) Example: > barplot(pressure$pressure, space = 3) 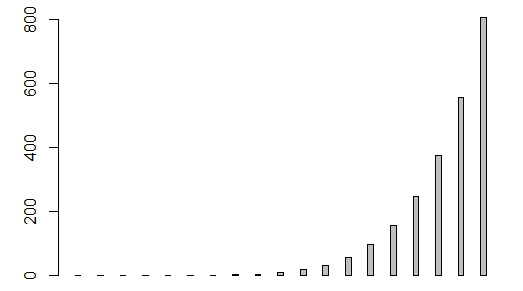
|
