|
|
Customize Bars in a Bar Plot
The simplest form of the bar plot includes grey bars with a black outline. These bars can be customized via arguments per the sections below. Customize Bar Width
The bar width can be customized using the width argument. Arguments should be entered as vectors. If vector length is less than # of bars, the argument values will be repeated. In order to change the width of all bars to the same value (i.e. make all bars thinner) a user must actually define the spacing between the bars. barplot( ElementContainingData, width = Vector) Example: > barplot(pressure$pressure, width = c( 1 , 3 )) 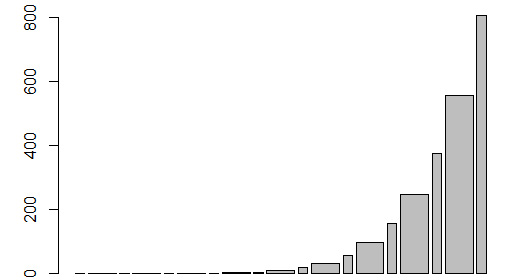
Customize Bar Color
The internal bar color can be customized using the col argument. Arguments can be entered as either values or vectors. If vector length is less than # of bars, the argument values will be repeated. Specifying a single value will color all bars with that argument. barplot( ElementContainingData, col = "ColorValueOrVector") Example: > barplot(pressure$pressure, col = c( "Red" , "Blue") ) 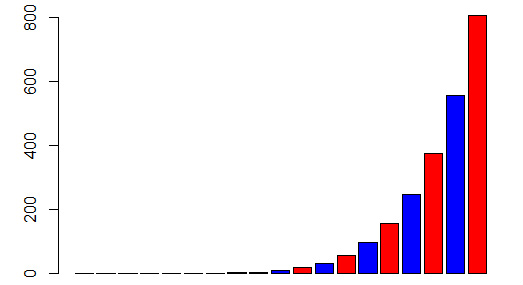
Add Shading to Bar
The internal shading can be added to bars using the density argument. The angle argument can be used to customize the slope of the shading lines. Arguments can be entered as either values or vectors. If vector length is less than # of bars, the argument values will be repeated. Specifying a single value will shade all bars with that argument. barplot( ElementContainingData, density = ValueOrVector, angle = ValueOrVector) Example: > barplot(pressure$pressure, density = c( 0 , 10), angle = 75) 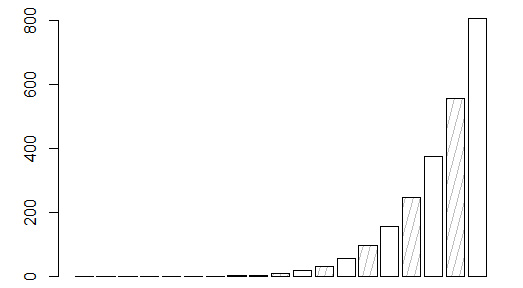
Customize Bar Outline Color
The bar outline color can be customized using the border argument. Arguments can be entered as either values or vectors. If vector length is less than # of bars, the argument values will be repeated. Specifying a single value will outline all bars with that argument. barplot( ElementContainingData, border = "ColorValueOrVector") Example: > barplot(pressure$pressure, border = c( "Red" , "Blue") ) 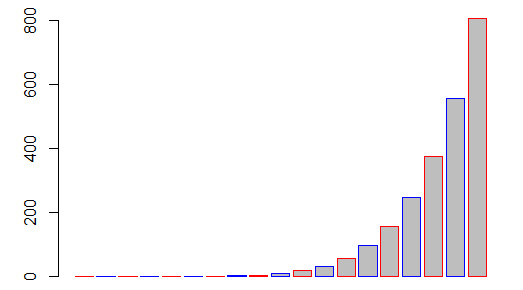
|
