|
|
Box Plot
A box plot is a chart that illustrates groups of numerical data through the use of quartiles. In the example below, data from the sample "chickwts" dataset is used to plot the the weight of chickens as a function of feed type.
ggplot(Data, aes(y = NumericVector, x = GroupingVector)) + geom_boxplot() Example:
> ggplot(chickwts, aes(y = weight, x = feed)) + geom_boxplot() 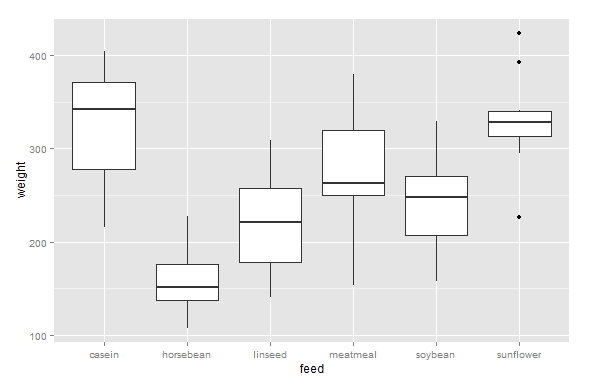
|
